On Oct. 8, 2021, the Center for Medicare and Medicaid Services released a fact sheet about 2022 Medicare Part C and Part D Star Ratings. We’ve previously published a Guide to Medicare Star Ratings for Insurers and created an infographic detailing data from the 2021 Medicare Star Ratings. With the release of the 2022 Medicare Star Ratings, let’s take a graphical look at 2022 Medicare Advantage Star Ratings.
But first, some items to note about the star ratings. There are three types of Medicare Advantage plans:
- Medicare Advantage-only plans without prescription drug coverage (MA). These plans earn their star ratings based on 28 measures.
- Medicare Advantage with Prescription Drug Coverage (MA-PD). These plans are rated based on the 28 measures of MA plans as well as 10 measures specifically for prescription drug plans.
- Prescription Drug Plans (PDP). These plans only provide prescription drug coverage and are rated on the 10 measures specifically for prescription drug plans.
The graphs below show the changes in Medicare Advantage star rating distribution among plans, by an organization’s tax status, by the length of time the plan has been in effect, and for individual rating measures.
Rating Distribution by Plan Enrollment
The charts below outline the percent of total Medicare Advantage enrollment by star rating for MA-PD and PDP plans from 2019 to 2022.

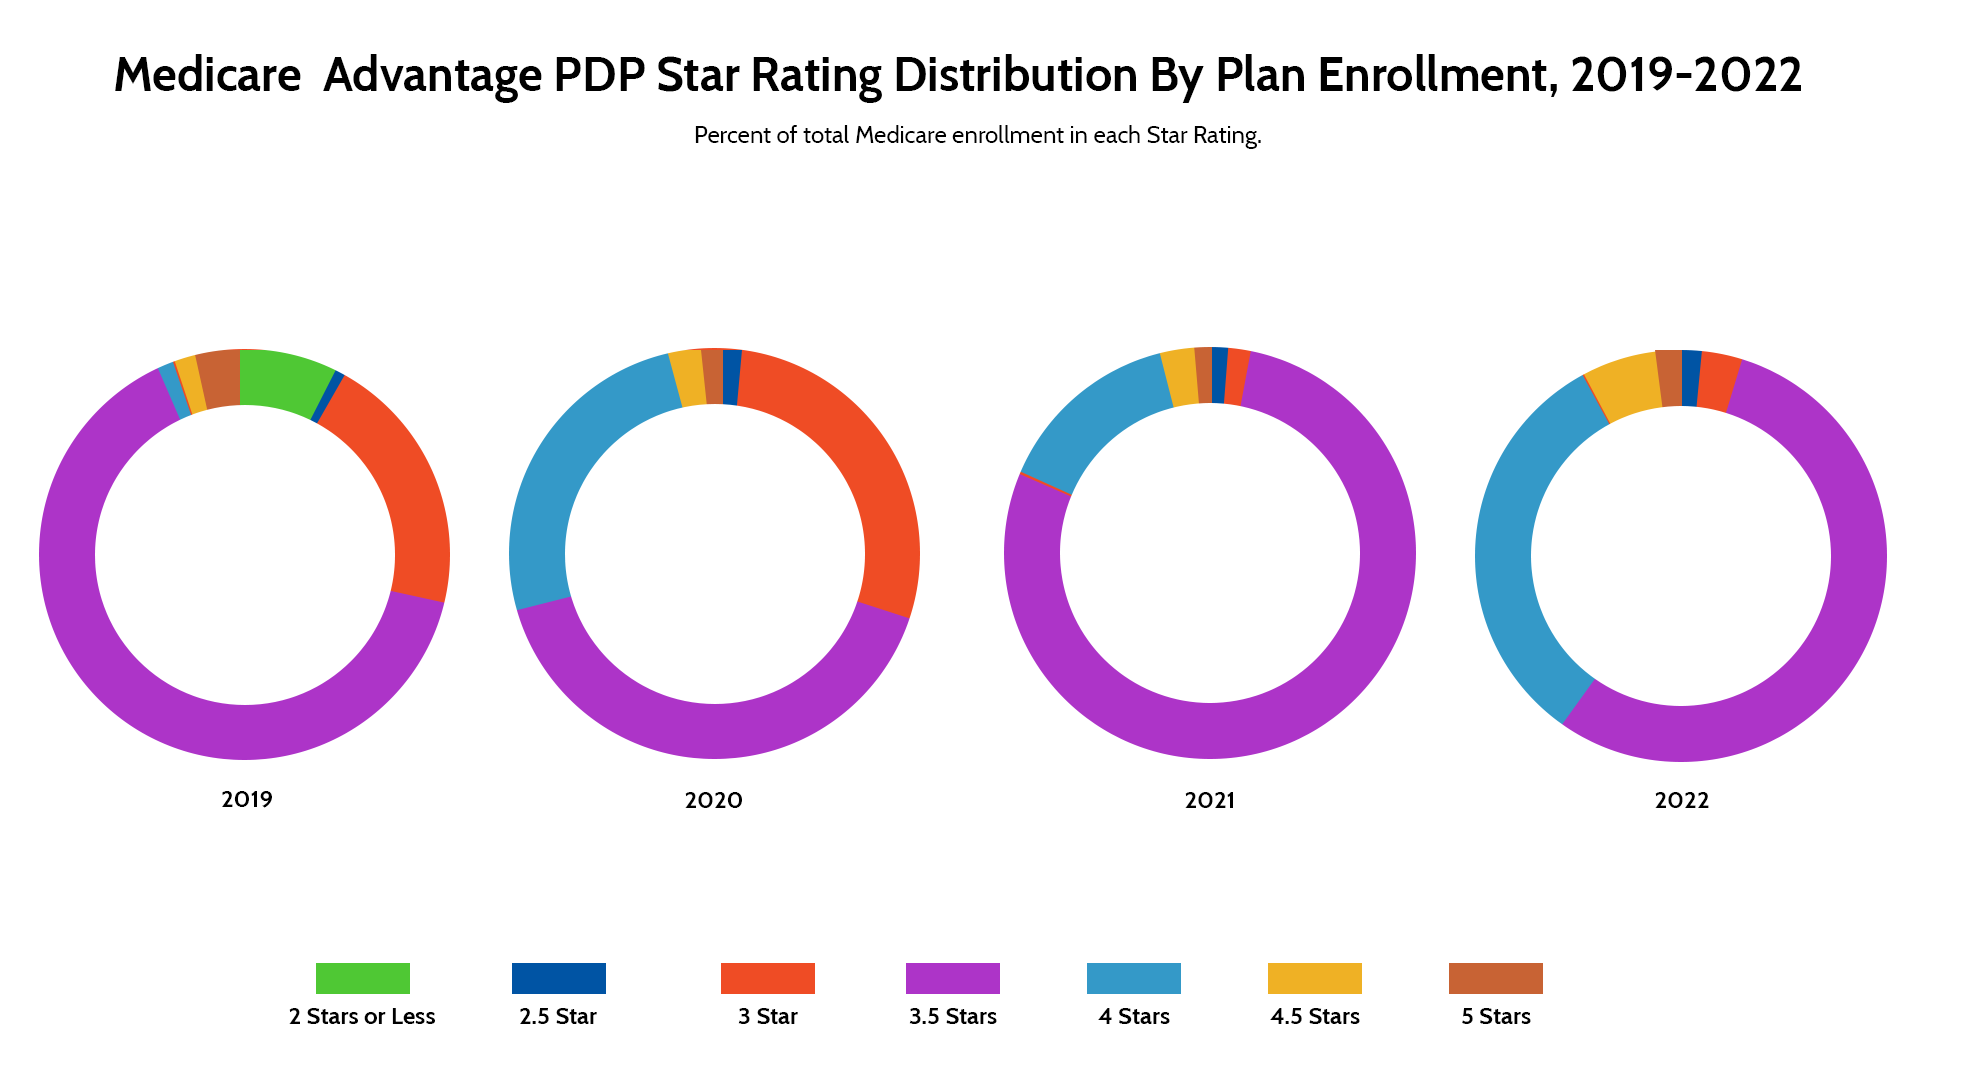
Takeaways:
- Enrollment in Medicare MA-PD plans is trending toward 4+ star plans. Where in 2019, about 75% of enrollees had enrolled in a 4 star or better plan, that number had increased to 90% by 2022.
- For PDP plans, that shift toward enrollment in higher star-rated plans is also occurring. In 2019, just over 90% of enrollees participated in 3 and 3.5-star plans. In 2022, just under 90% of enrollment is in 3.5 and 4-star plans.
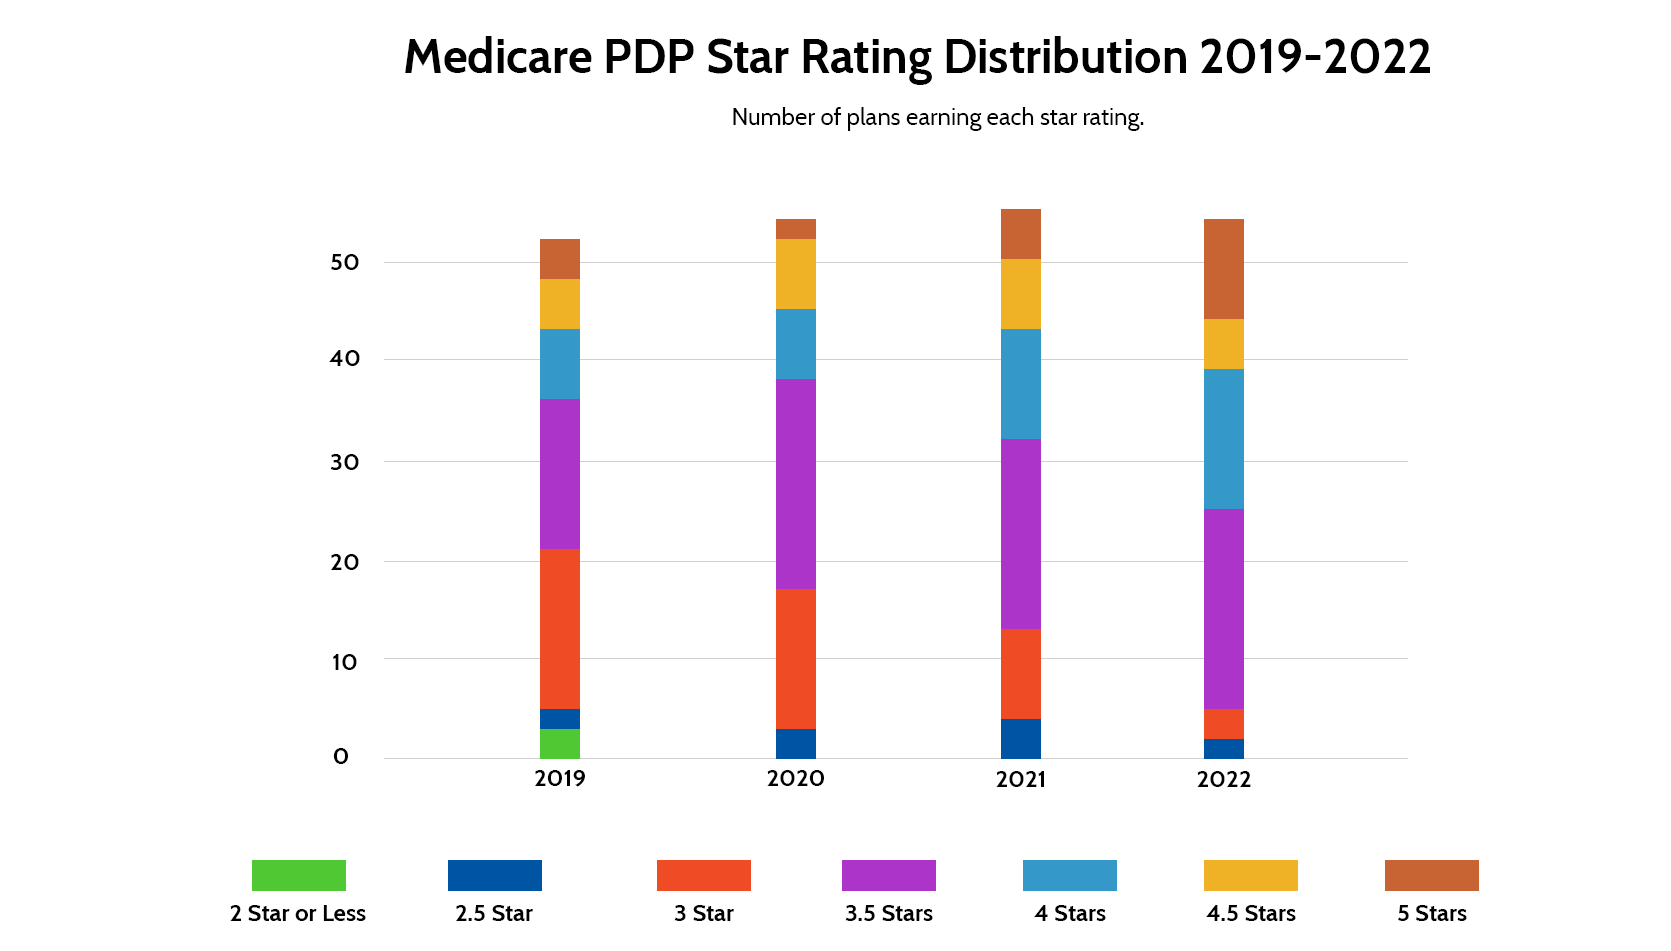
Medicare Advantage Star Ratings Rating Distribution by Plan Count
The charts below outline Medicare Advantage Star Rating distribution for MA-PD and PDP plans by total count.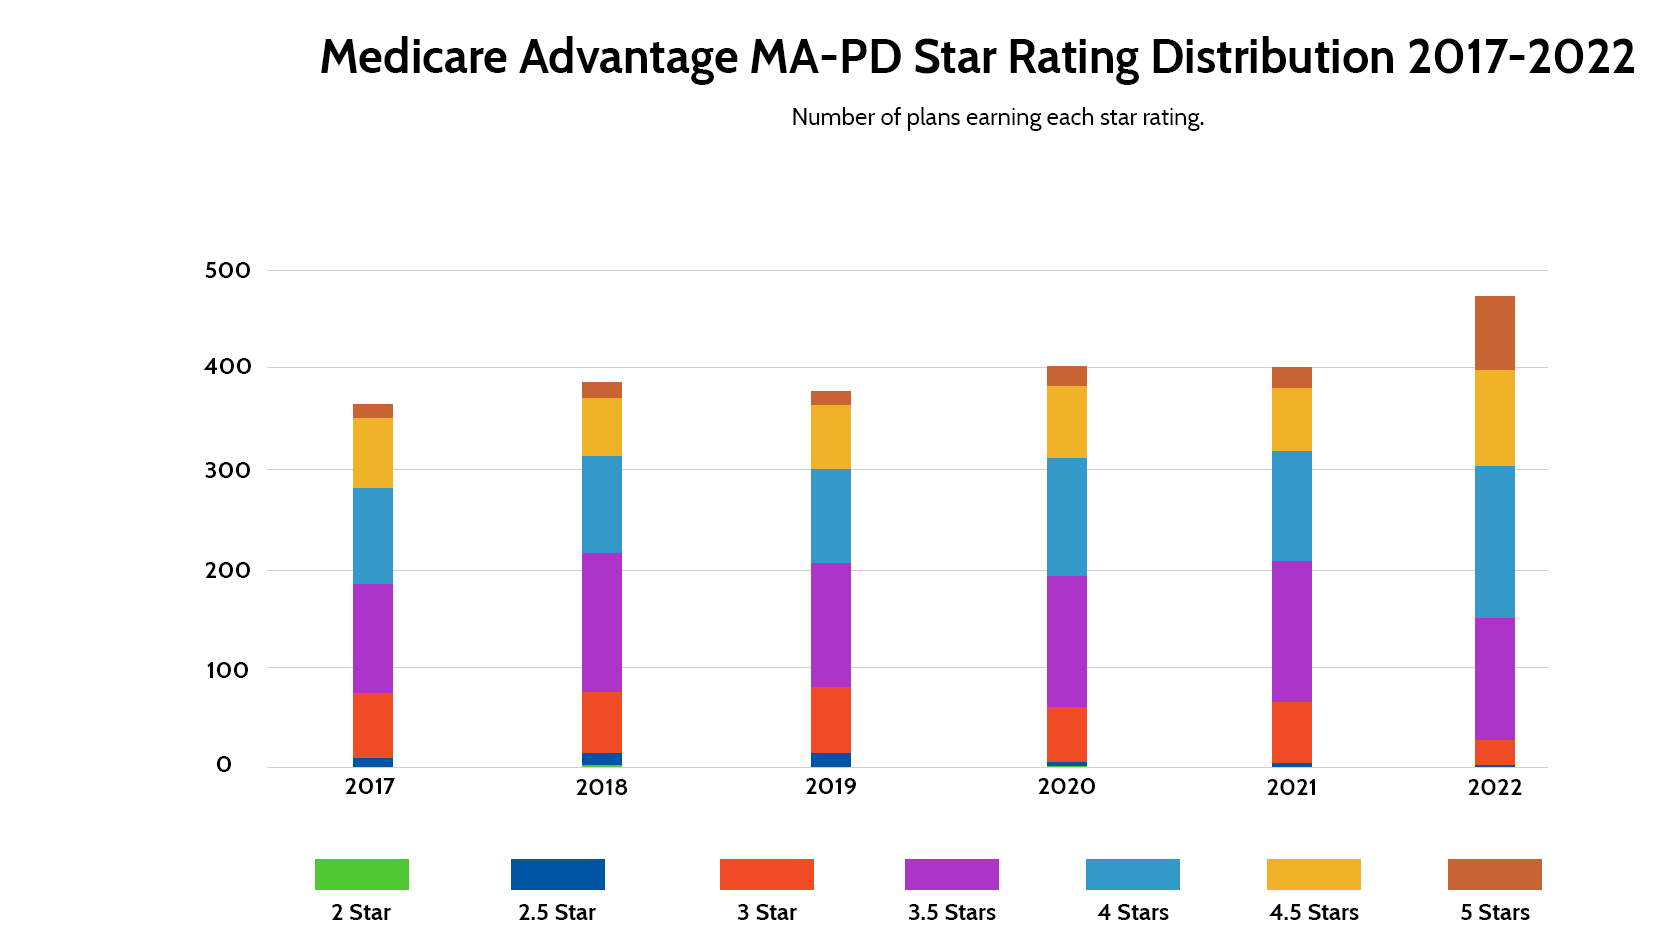
Takeaways:
- With the number of available plans growing, the number of 4+ star plans is also growing for both MA-PD and PDP plans.
Medicare Advantage Star Ratings by Non-profit vs. For-profit
The charts below outline Medicare Advantage Star Rating distribution of MA-PD plans by tax status – either for-profit or non-profit.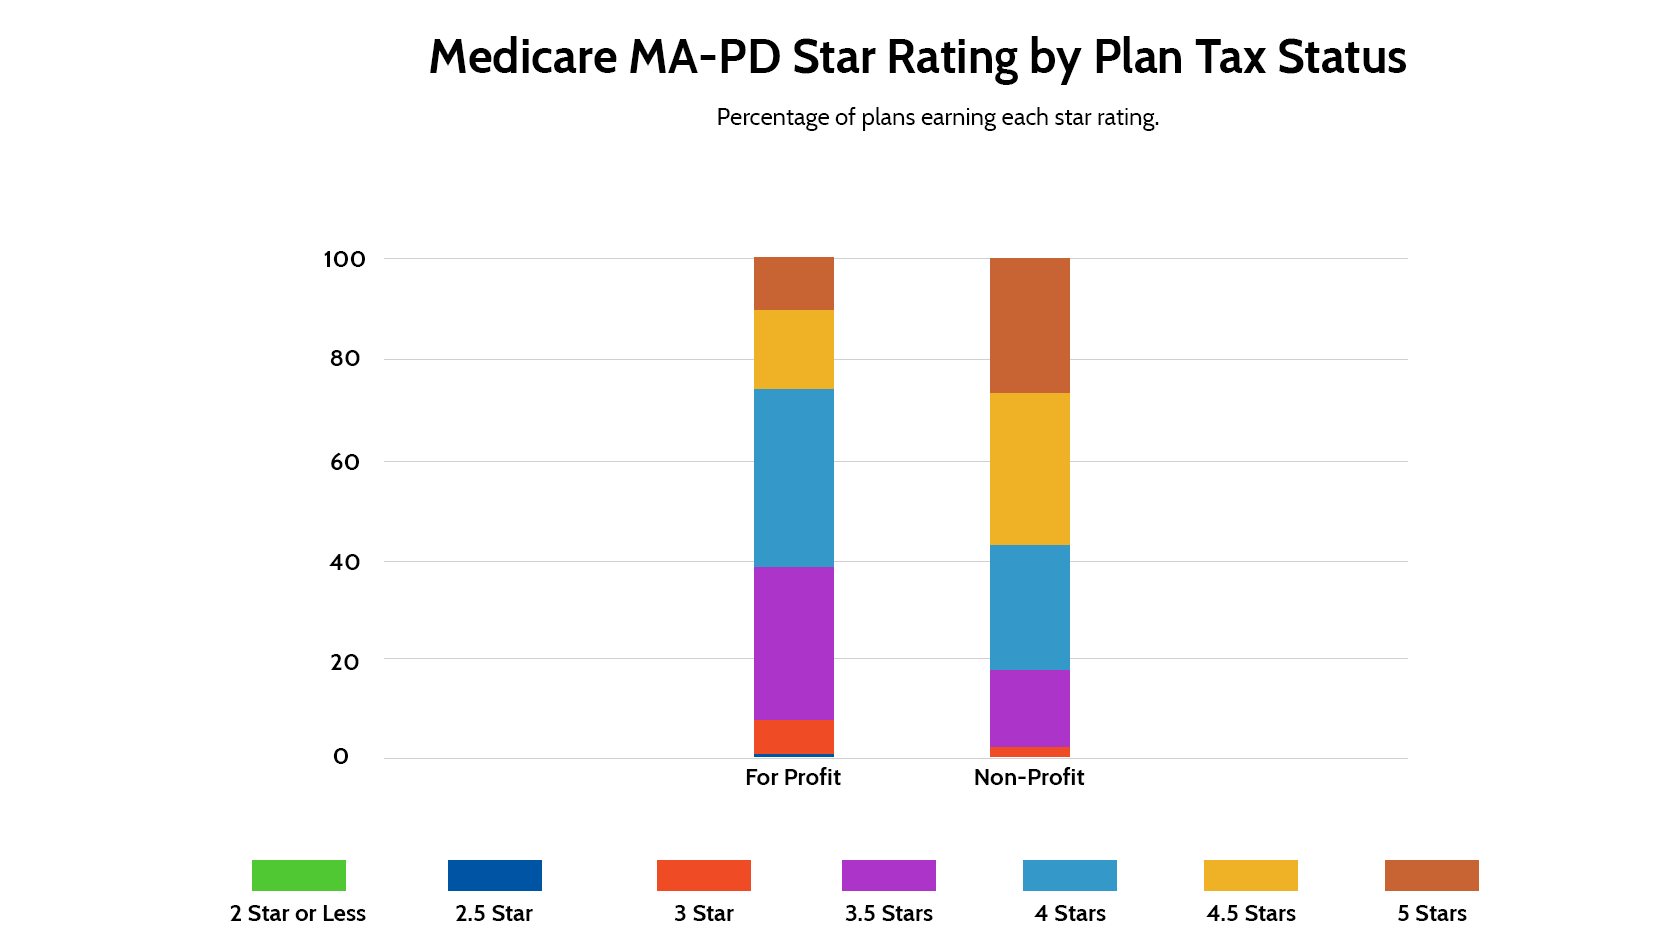
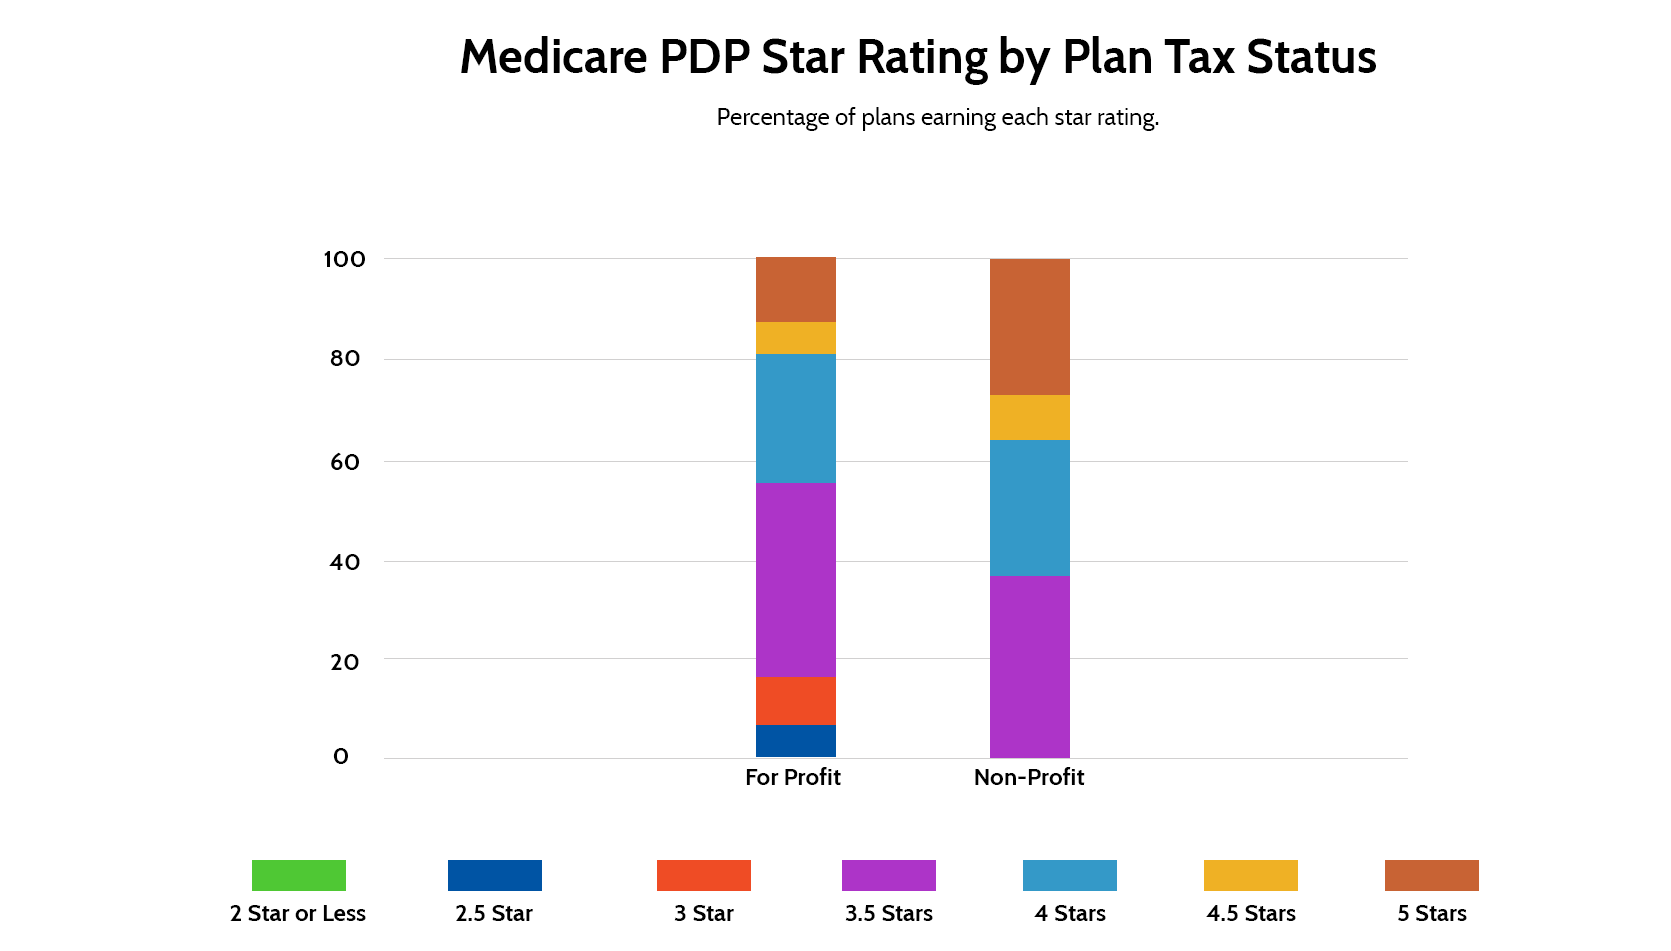
Takeaways:
- Interestingly, non-profit organizations were more likely to earn higher star ratings, with more than 80% of MA-PD and 60% of non-profit PDP plans earning 4+ stars. For-profit numbers were about 20% less for both MA-PD and PDP plans.
Medicare Advantage Star Ratings by Program Longevity
The charts below outline Medicare Advantage Star Rating distribution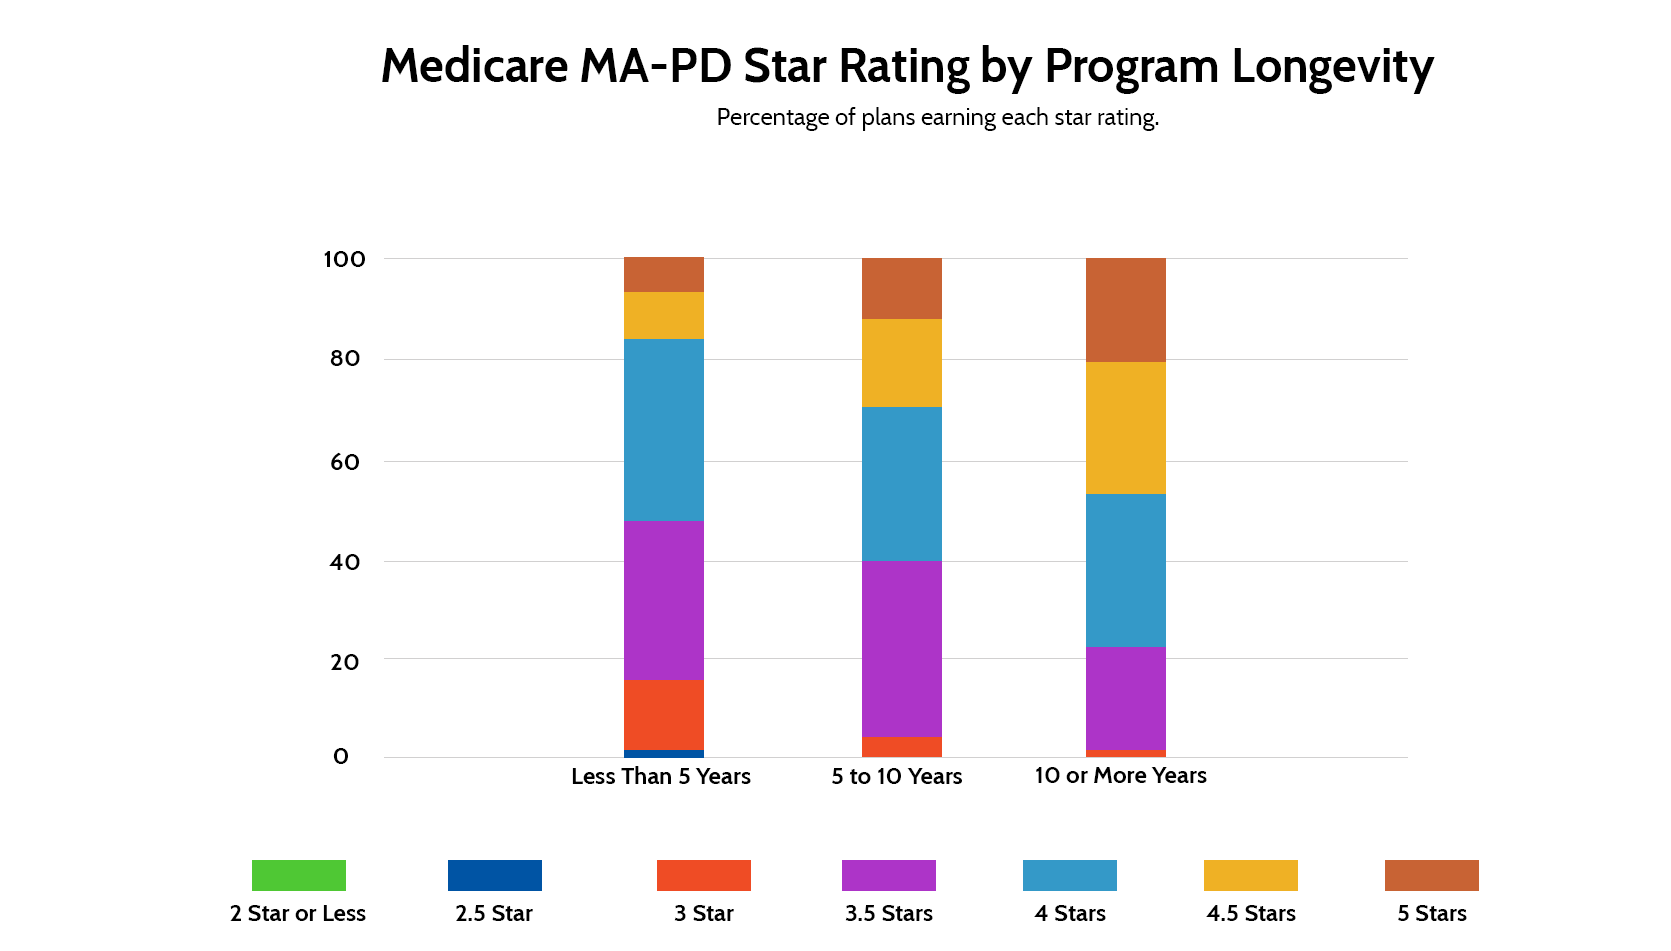
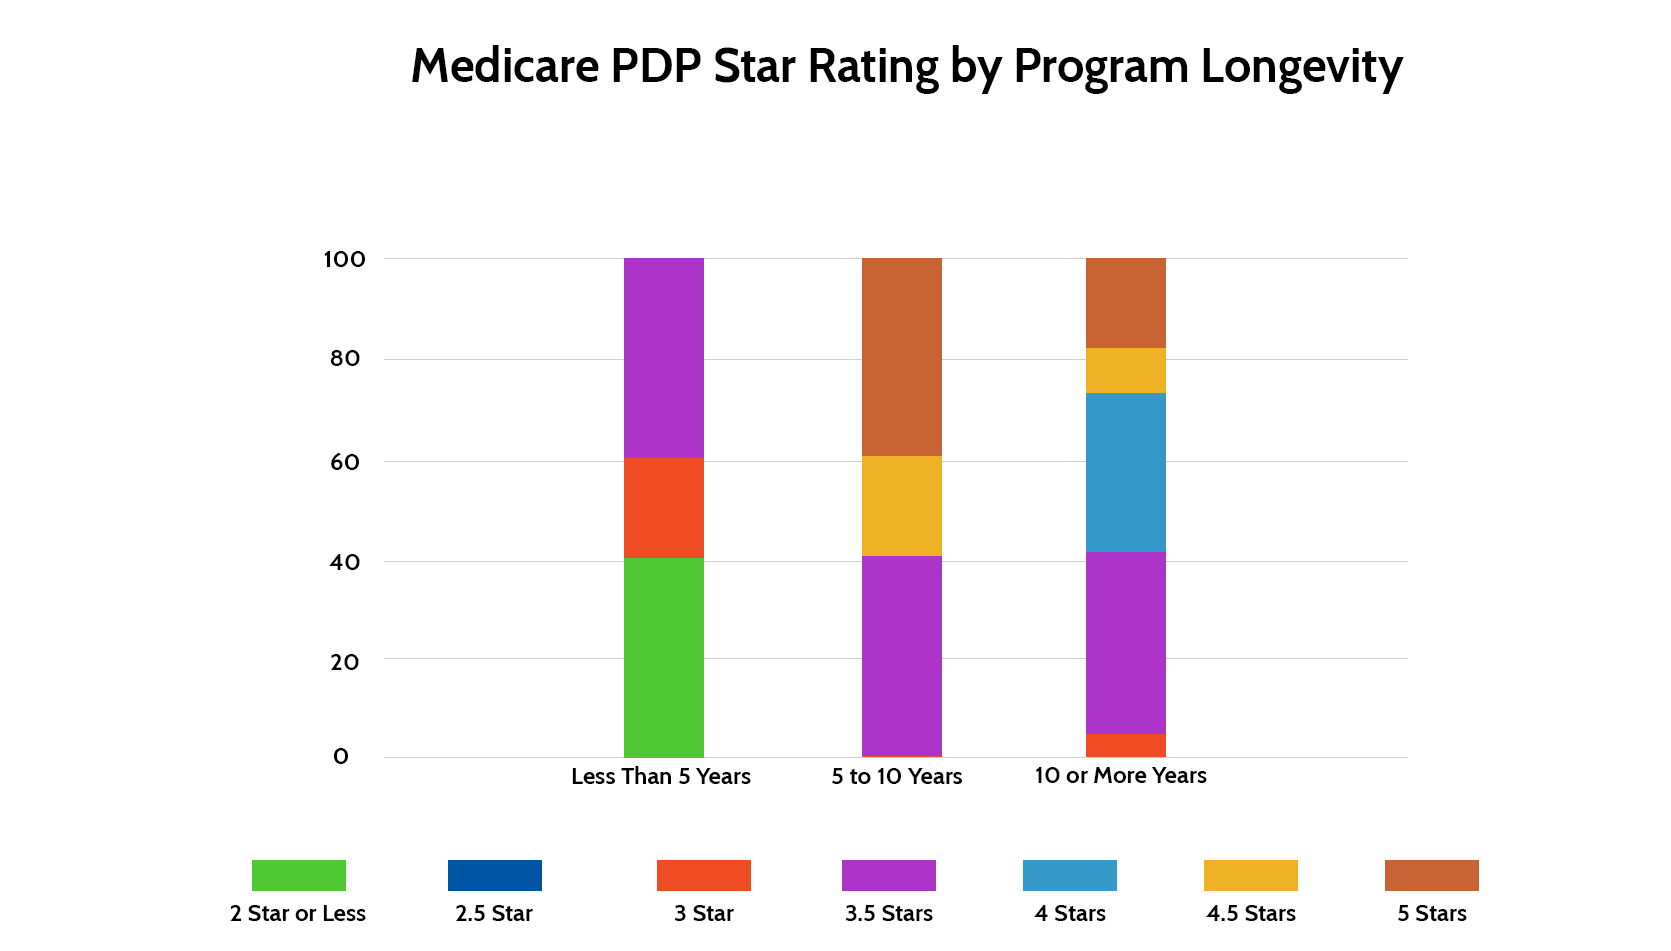
Takeaways
- New MA-PD plans are much more likely to have lower ratings than plans with more experience. Most of the 3 stars or fewer plans have less than five years of experience.
- Note that for PDP plans, there really aren’t enough new plans to draw conclusions. Only 5 plans have less than 5 years while another 5 have less than 10 years.
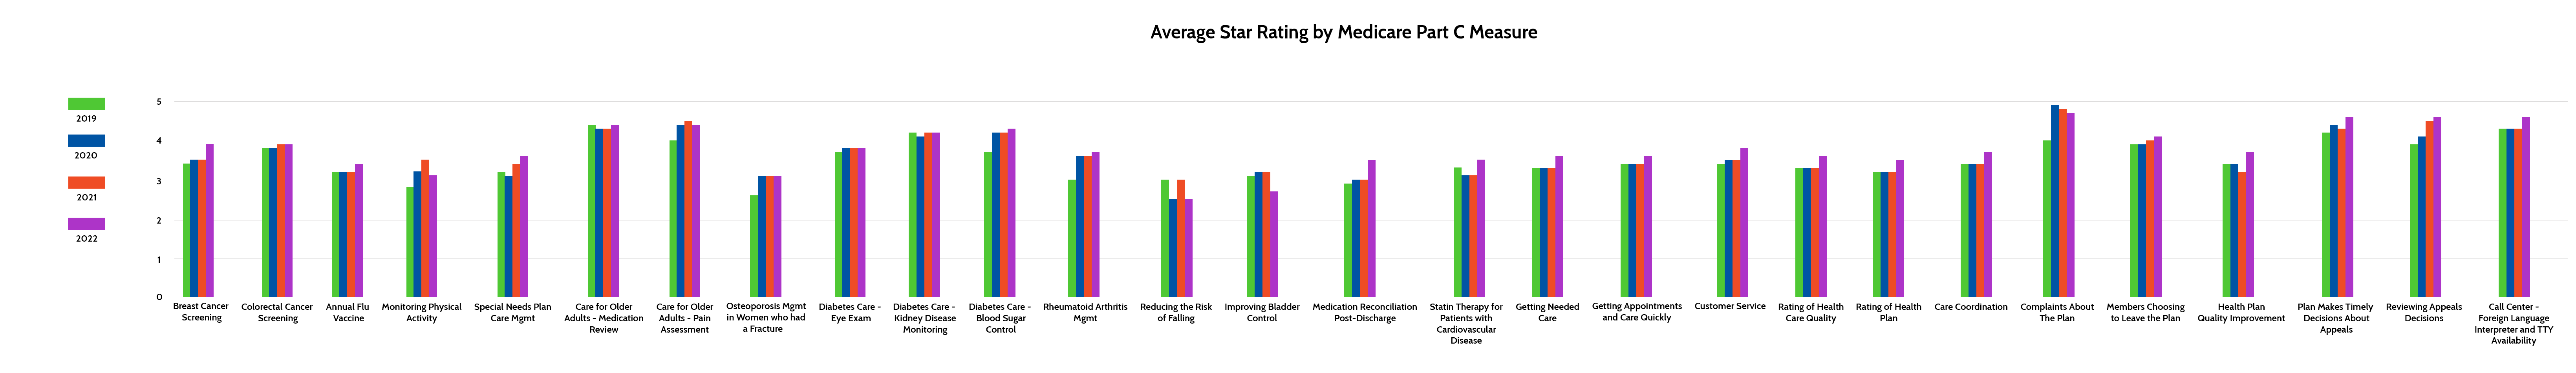
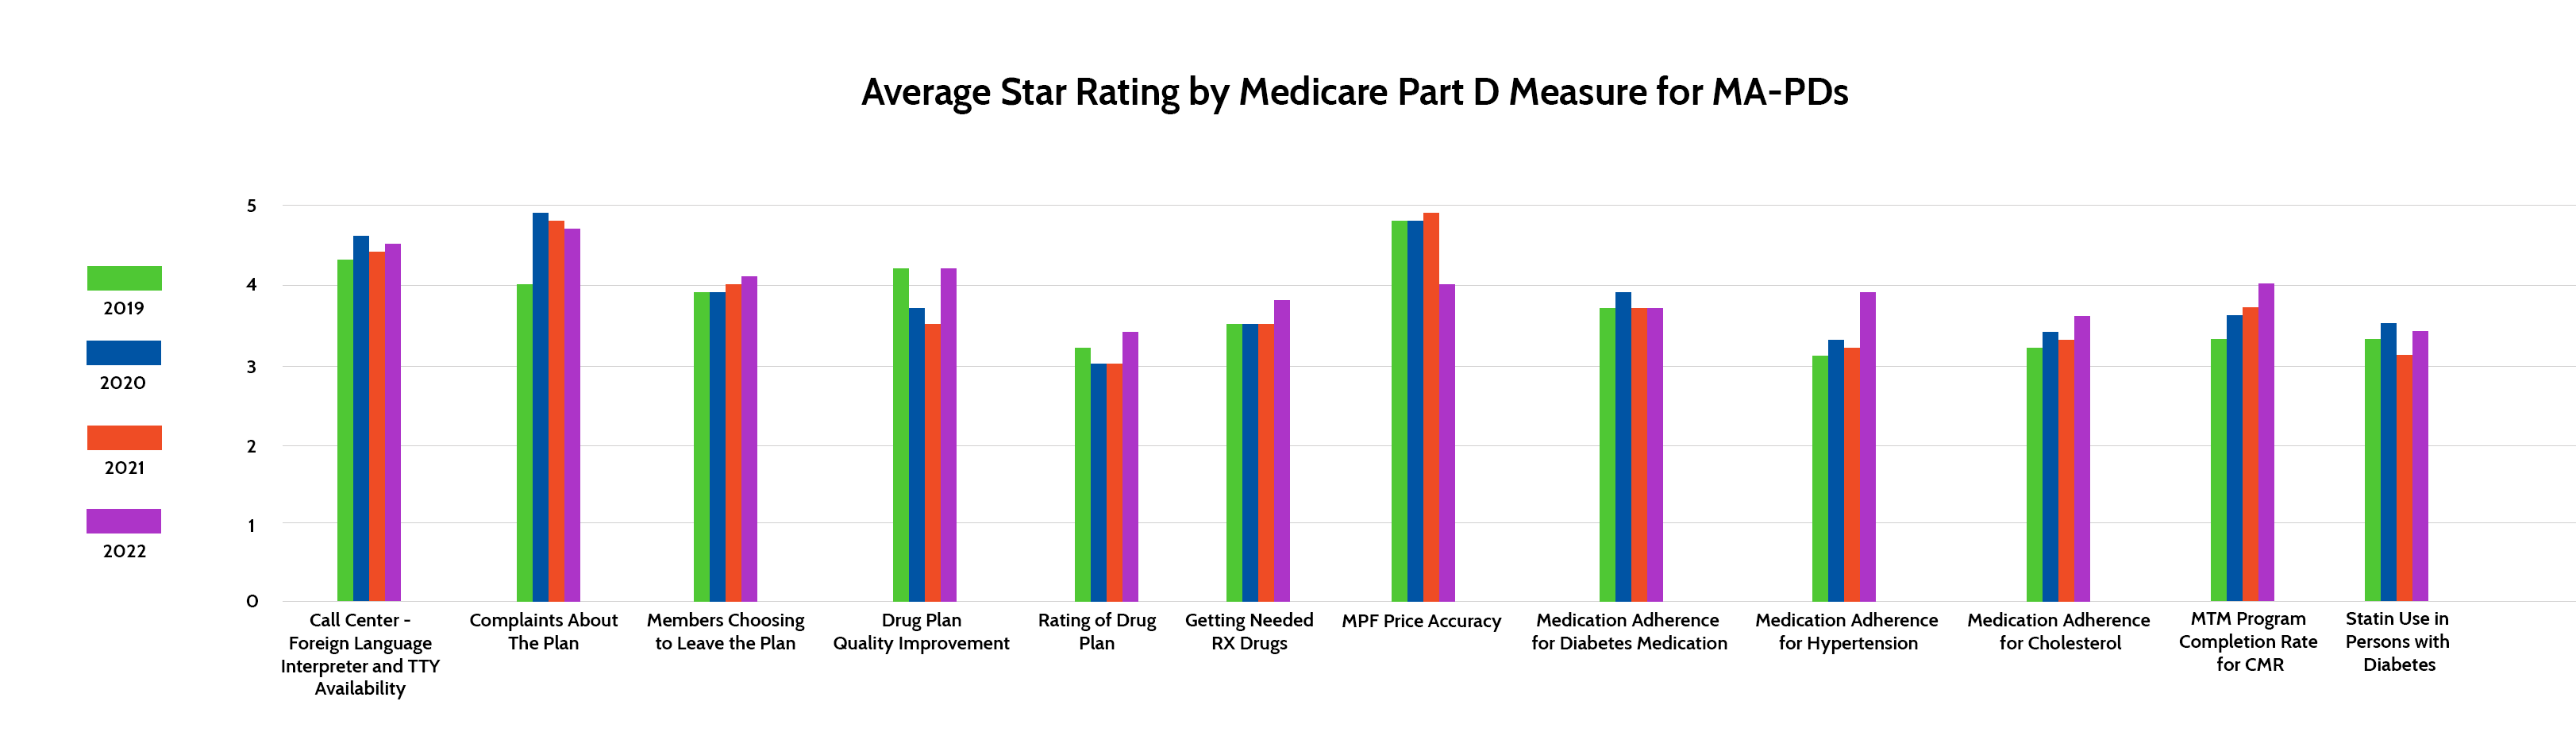
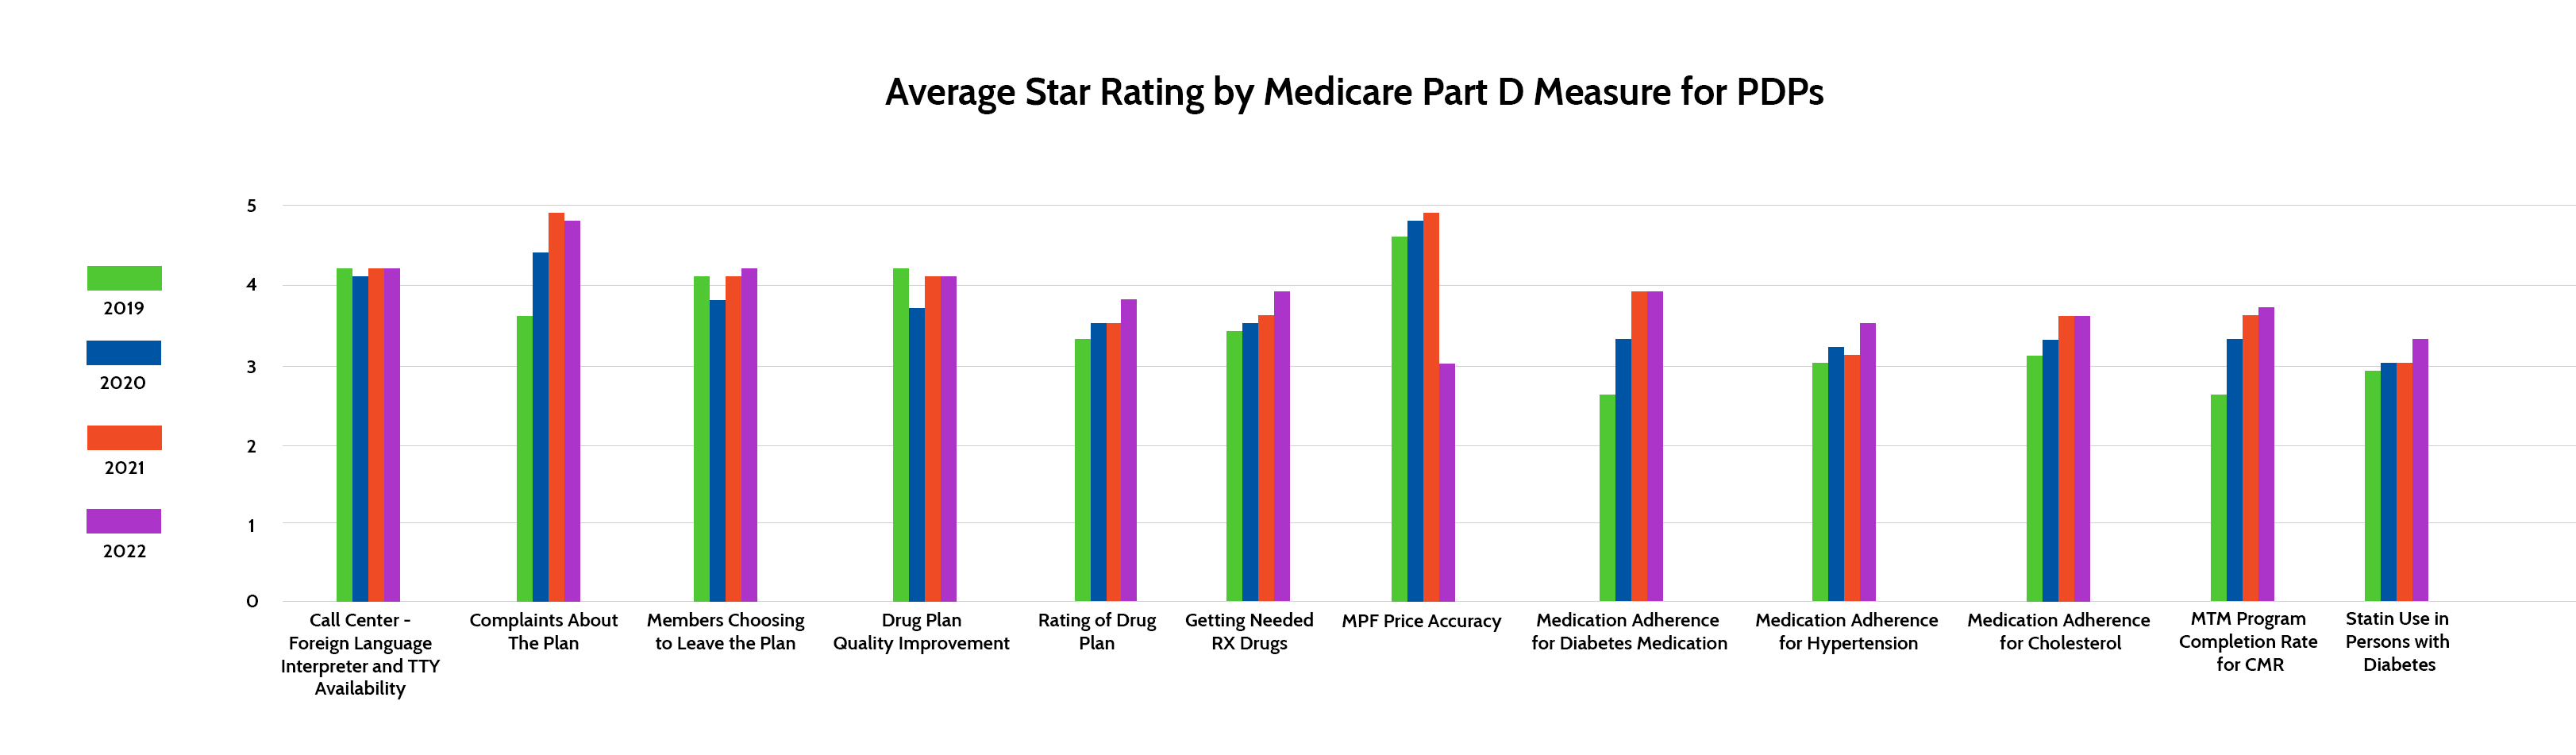
Medicare Advantage Star Ratings by Measures
CMS uses specific measures to determine star ratings for plans. As previously discussed, Medicare Part C measures are used to determine MA and MA-PD ratings, while Medicare Part D measures are used to determine MA-PD and PDP ratings. Shown below are the ratings for each measure over the past four years.
Certifi’s health insurance premium billing and payment solutions help healthcare payers improve member satisfaction while reducing administrative costs.


